Capabilities
Tested the same way, every time - on an automated RF bench
Every unit we service runs through Otto, our automated test bench. It connects to your equipment and to every calibrated instrument on the bench, runs a standardized checkout, and prints a clear pass/fail record. The engineer's checkout procedure is encoded into the bench itself, so every unit gets the expert's full standard - repeatable, documented, and identical for every unit of a model. AI assists the evaluation - analyzing the measurements, flagging anomalies against the unit's archived history, and drafting the findings - and an experienced RF engineer reviews and signs off on every result.
Confidence, documented - not "it depends who tested it"
Automation and AI don't replace the engineer's judgment - they make sure your unit is measured against published specs with calibrated references, the same way on a Monday morning as at the end of a long Friday, with every result reviewed before it ships.
Right, and repeatably right
Your unit is checked against published specifications with calibrated reference instruments, using the same automated sequence every run - so results don't depend on who tested it, or when. If it passes, it genuinely meets spec.
A real record on your ticket
Test results land on your service ticket in real time as Otto runs. A repair usually takes several runs; the ones that matter are saved to your ticket - the measurements behind the diagnosis, and the measurements showing the repair fixed it - and they stay there for you to see and keep.
AI-assisted, engineer-verified
AI helps analyze the measurement data - comparing results against spec and your unit's archived history, flagging anomalies, and drafting the written findings. An experienced RF engineer reviews every result and makes every call.
Faster turnaround
Automated testing takes minutes of hands-on time instead of hours, so units move through service and back to you sooner - without cutting any corners on the checkout.
Repeatable history
Each report is archived and version-numbered. If a unit comes back later, its full test history is on file to compare against - so we can spot drift or new damage.
Backs our calibration & blueprint work
The same bench drives our calibration and blueprint services - the measured data in those reports comes straight from these automated sweeps.
One screen runs the whole bench - safely
- One application, the whole bench. Instead of juggling separate utilities for the multimeter, scope, signal generator, power supply, analyzers, and switches, everything is controlled from a single dashboard. Pick a test, press start.
- The hard parts are handled. The system sets up instruments, switches the RF path, ramps power safely, takes the readings, applies the pass/fail limits, and writes the report - automatically, with built-in safety stops including an emergency all-off.
- Less room for human error. No manual transcribing of numbers, no forgotten step, no misread limit. The procedure is identical every run.
- Live view of what's happening. Real-time spectrum and data displays let us watch the unit's behavior as the test runs, which makes troubleshooting faster when something doesn't pass.
- The bench checks itself. Otto runs its own calibration routine to confirm the instruments still agree with the reference before results are trusted. We calibrate against commercially available calibration standards, and instruments are sent out for calibration periodically. That catches drift early - a reading is only worth what the instrument behind it is worth.
The bench software, at work
Actual screens from Otto - the same software that runs your unit's checkout. Click any screenshot for the full-size view.
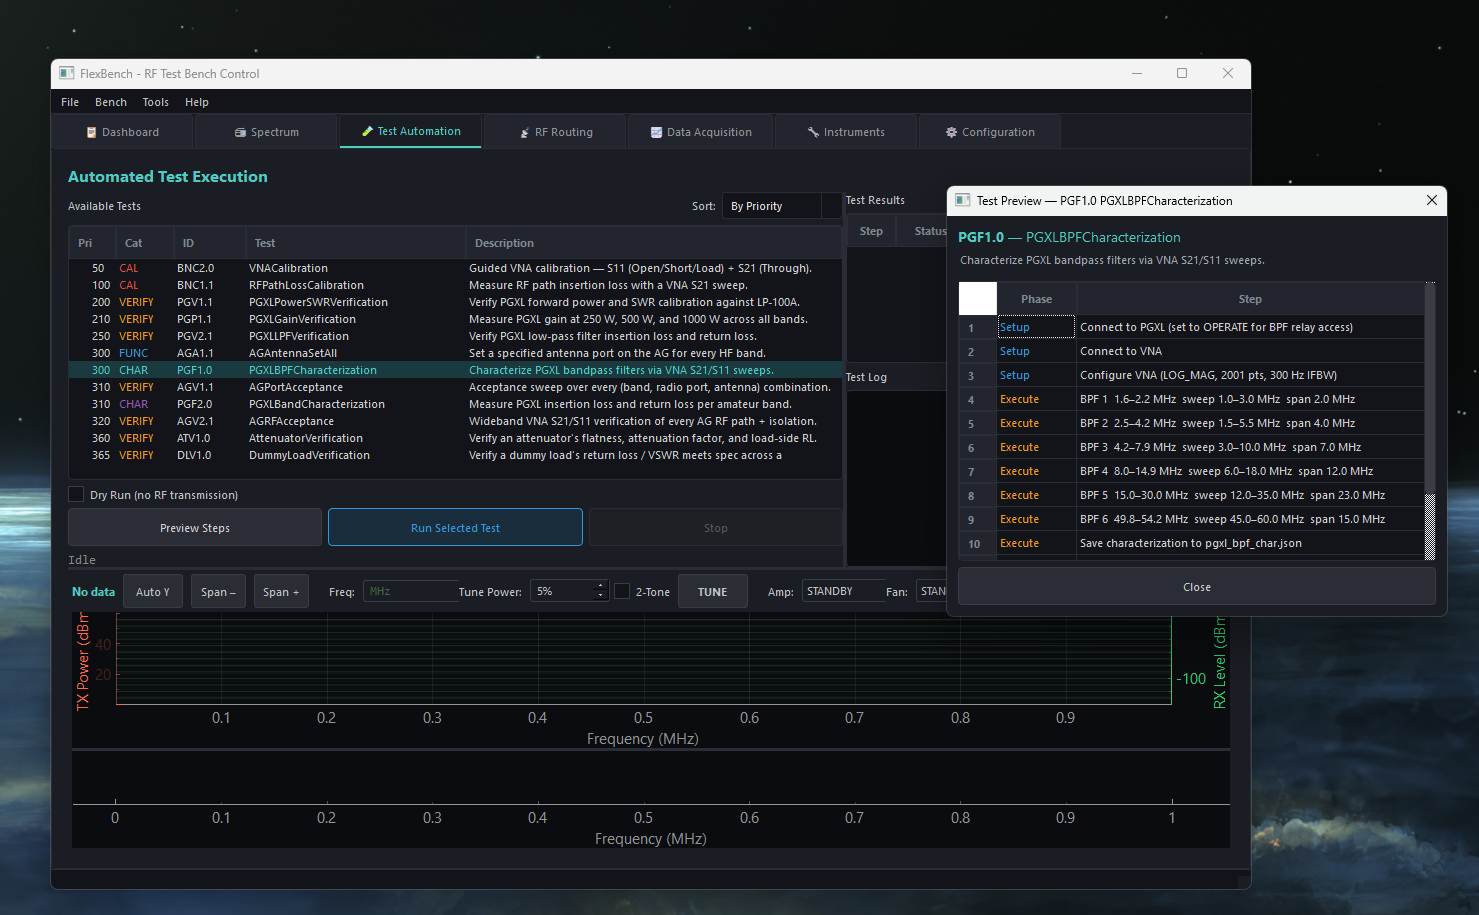
Automated test execution
The test catalog, sorted by priority - calibration, verification, and characterization sequences. Every test can be previewed step by step before it runs, and a dry-run mode rehearses it with no RF transmission.
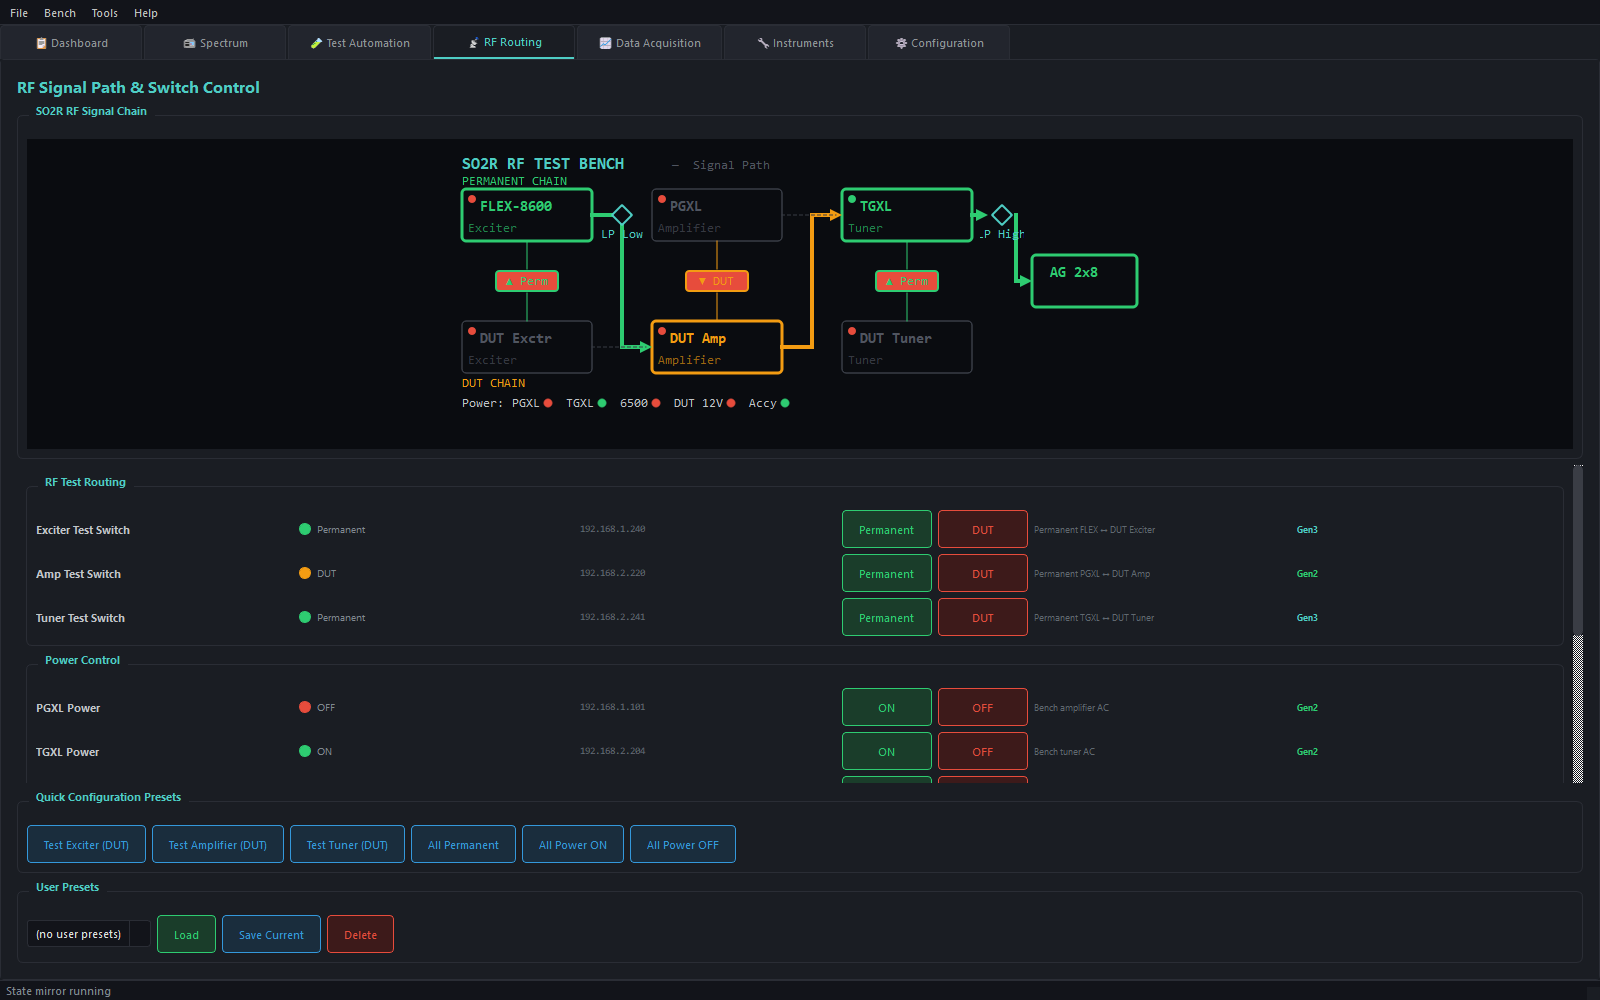
RF signal path & switch control
A live diagram of the bench's RF chain. The software routes your unit into the signal path, controls bench and device power, and applies one-click configuration presets - no manual recabling between tests.
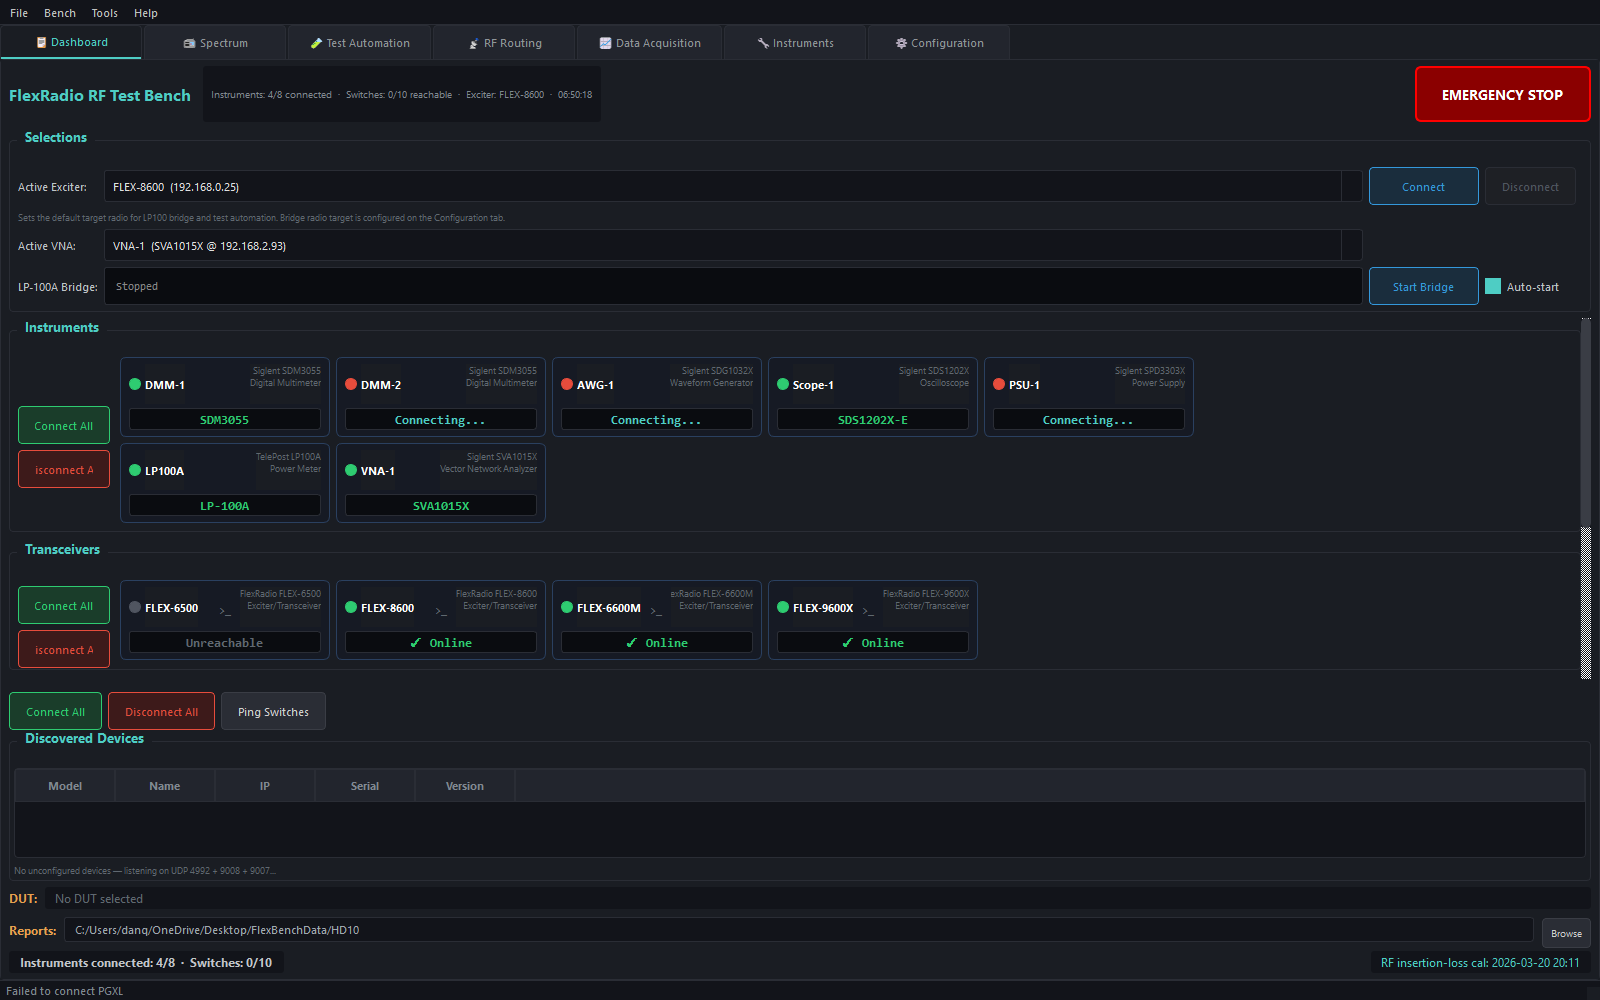
One dashboard, the whole bench
Every instrument and exciter on the bench, with live connection status - and the emergency all-off that can shut the entire bench down in one click.
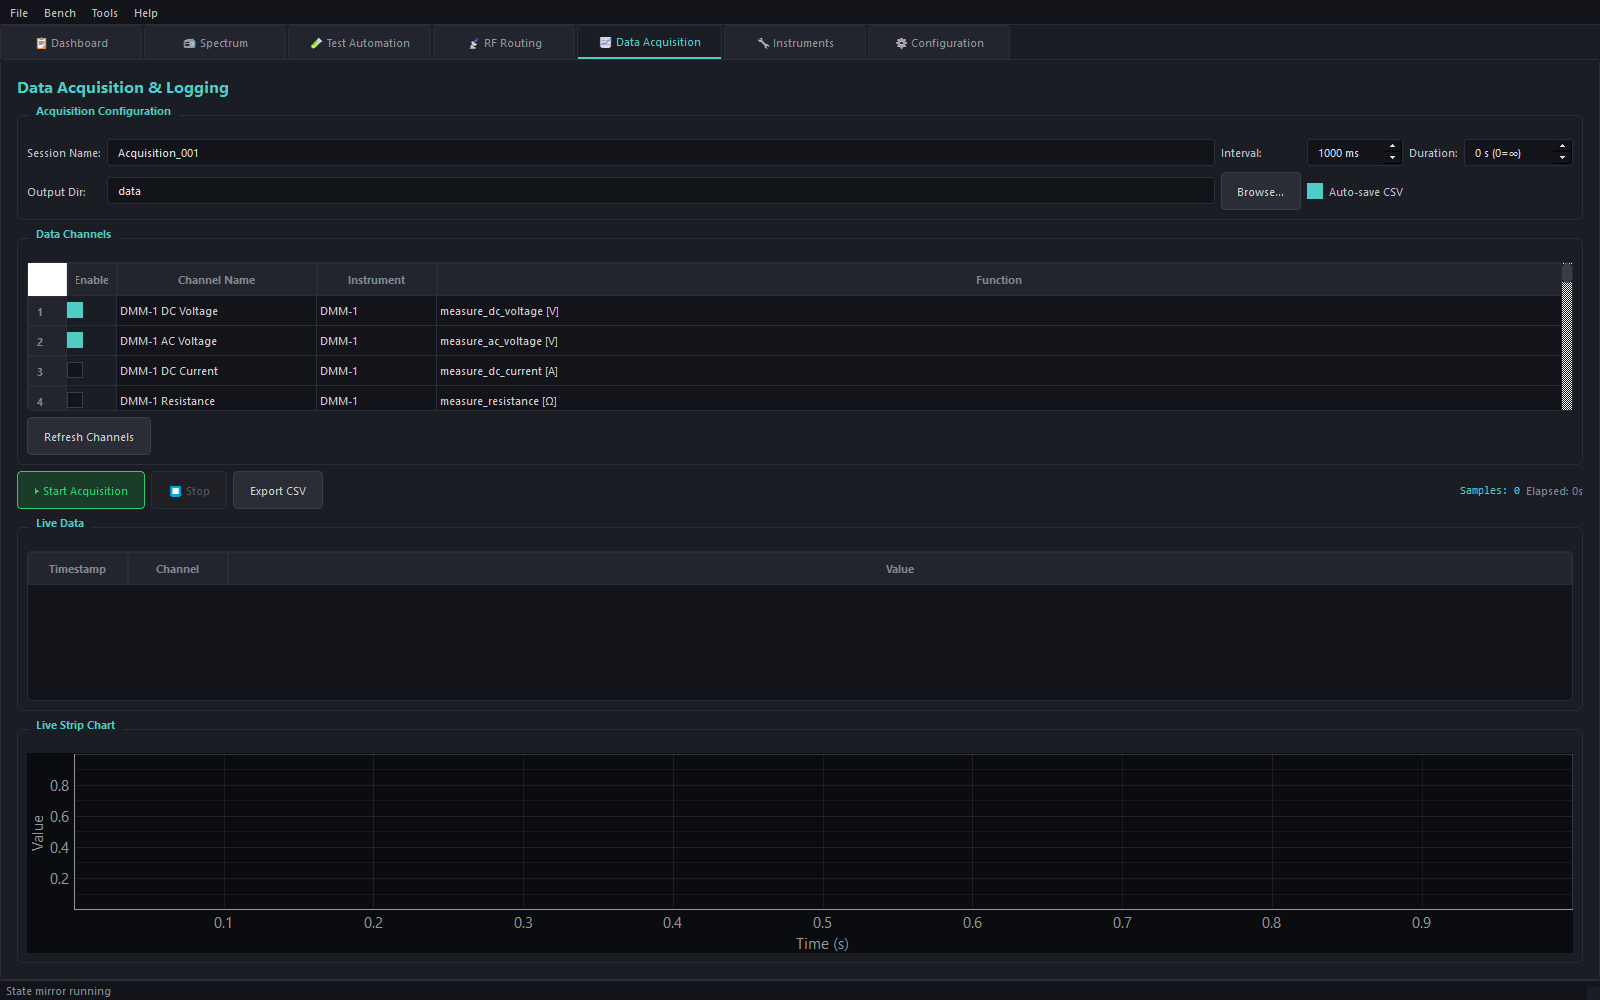
Data acquisition & logging
Any instrument channel can be logged to timestamped CSV with live charting - the raw measurement data behind the reports, captured as the test runs.
Under the hood
Some of our customers want to know exactly how the bench works. If that's you, open the sections below - the short version is above, the engineering detail is here.
What Otto is platform
Otto is a cross-platform application built on Python and the Qt (PySide6) framework. It runs wherever its Python runtime and instrument network are available - it isn't tied to a single operating system. It replaces a collection of manual, single-purpose utilities and operator-driven measurements with one supervised control system that connects to every instrument and product on the bench, runs standardized test sequences, and produces archived pass/fail reports.
It's a general-purpose test-automation platform. Its first production application is servicing and acceptance testing of high-power RF amplifiers and antenna tuners, but neither its supported instruments nor its supported products are limited to any one vendor - the architecture targets any controllable instrument or device under test.
Instruments & products it controls hardware
Bench instruments (SCPI/LAN): Siglent multimeter (SDM3055), oscilloscope (SDS1202X-E), waveform generator (SDG1032X), DC power supply (SPD3303X), and two VNA / spectrum analyzers - Siglent SVA1015X and Rigol RSA3015N - plus the TelePost LP-100A vector wattmeter as the calibrated power reference.
Products under test (current - extensible): the platform ships with support for the Power Genius XL (PGXL) amplifier, Tuner Genius XL (TGXL) tuner, FlexRadio exciters, and the 4O3A Antenna Genius switch, each over its native control API. This is the current list, not a fixed one - additional amplifiers, tuners, switches, and devices from any vendor can be added through the same mechanism.
Switching & power: Shelly relays (Gen 1/2/3) for RF-path routing, product power, DUT power, and bench lighting, with an emergency all-off shutdown.
Plug-in test sequences test catalog
Automated tests are plug-ins, not hard-coded features. Each test is a self-contained module built on a common AutomatedTest base (setup → execute → teardown, with pass/fail criteria and thread-safe abort) and registered into the test catalog. New procedures can be authored and dropped in without modifying the core application - the suite grows by addition, not rewrite.
The shipping catalog already includes power/SWR calibration, gain verification across power levels and bands, band-pass- and low-pass-filter characterization, RF path-loss calibration, multi-point antenna-switch acceptance, and standalone attenuator, dummy-load, and VNA-calibration routines.
Extensible, vendor-neutral device support architecture
The set of supported devices is open-ended. Any controllable product or instrument that exposes a SCPI, TCP, serial, or HTTP control interface can be added by writing a driver and registering it. The same plug-in pattern that grows the test suite grows the device canon, so the platform isn't limited to today's hardware list.
Reporting, live measurement & resilience data + ops
Standardized reporting. Every test run auto-generates a timestamped, serial-tagged report set - human-readable text, raw JSON data, and exported plot images - filed into a configurable directory with automatic revision numbering, giving a traceable acceptance record per unit.
Live measurement & visualization. A real-time panadapter/waterfall spectrum display (VITA-49 streaming) plus a configurable data-acquisition engine that logs any instrument channel to timestamped CSV with live charting.
Operator interface. A unified dashboard with seven workspaces: connection status, spectrum display, test automation, RF routing, data acquisition, per-instrument panels, and bench configuration.
Resilient operation. Auto-discovery and reconnection that survives DHCP address changes, backward-compatible config persistence, and a central orchestrator (BenchManager) that coordinates instruments, switching, data acquisition, and tests with safety interlocks.
Want your unit checked out on the bench?
Open a repair, calibration, or blueprint request and your unit gets the full automated checkout - with the report to prove it.